Trump’s Budget Policies Make the Poor Poorer to Pay for War and Help the Rich
A report by the Institute for Policy Studies, the Yale Center for Public Theology and Public Policy, and Repairers of the Breach.
Budgets are both policy and moral documents. The Trump-GOP budget agenda, which cuts programs for the poor to give tax cuts to the wealthy and big corporations and more money to the war machine and mass deportations, is not a moral policy agenda.
This brief report summarizes some of the Trump-GOP’s most immoral budget priorities, from those that have already been enacted to those that are now being proposed.
Failed Budget Priorities: Making the Poor Poorer to Help the Rich and Fund Violence
In March, the president summed up his own approach: “‘The U.S. can’t take care of daycare…. We’re fighting wars. Medicaid, Medicare — they can do it on a state basis. We have to take care of one thing: military protection. But all these little scams that have taken place, you have to let states take care of them.”
Last year’s Big Ugly Bill, praised by Trump and narrowly passed by Congress, did three big things: cut social safety net and health care programs, give tax cuts to the wealthiest, and spend billions for war and mass deportations.
This year, Trump and his GOP allies are planning to do more of the same. Their priorities for this year include supplementing the war budget to bring the total from $1 trillion in FY 2026 to $1.5 trillion in FY 2027; providing more money for the president’s immoral mass deportation and detention agenda; and cutting off more poor and low-income people from programs that help counter the injustices in our economy.
The theme of these budget priorities is clear and consistent: taking from the poor to enrich the wealthy and inflict violence at home and abroad.
More People Struggle to Get Healthcare or Go Without
The Big Ugly Bill and other policy changes have made health insurance and healthcare more expensive or unavailable:
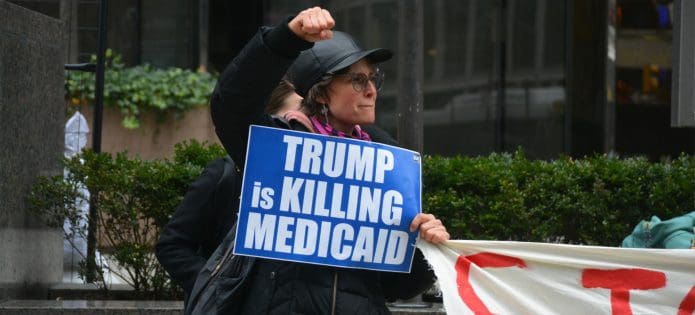
- The Big Ugly Bill’s cuts to Medicaid and the Affordable Care Act, combined with new administrative hurdles to accessing benefits, could result in an estimated 51,000 preventable deaths per year.
- More than 14 million people are at risk of losing health insurance due to cuts to Medicaid, cuts to assistance with health insurance costs through the Marketplaces (also known as Affordable Care Act), cuts to Medicare, and other policy changes.
- So far, early data indicate that one million fewer people signed up for health insurance through the Affordable Care Act marketplaces after costs rose in January 2026. That’s likely an undercount of those who are losing their marketplace insurance, because some people drop out once they are required to start making payments.
- For people who buy their health insurance through the Affordable Care Act marketplaces, a survey found that more than half said their health insurance costs were “a lot higher,” and 55 percent said they planned to cut back on other household spending to afford health insurance after GOP policy changes cut back on government assistance for health insurance premiums.
- The Big Ugly Bill required evidence of employment for many people who get insurance through Medicaid. Research shows that the rigid, red tape-laden work requirements in the bill are unlikely to actually increase employment. Most Medicaid enrollees already work, and even those who do work can end up without healthcare if red tape trips up their ability to prove it. Those who do not work are often caring for family members or attending school or have a disability. Formerly incarcerated people also face particularly high barriers to employment.
- The law’s changes to Medicaid financing mechanisms pose a particular threat to rural hospitals because they rely more heavily on Medicaid revenue than urban facilities. More than 700 rural hospitals are already at risk of closure, and at least 338 rural hospitals are at increased risk due to changes in this law. To buy off critics, Republicans included a rural health fund that is expected to cover less than a third of projected rural Medicaid losses.
More People Go Hungry
- Nearly half of Americans in a November poll said they were struggling to afford basic necessities like groceries, utility bills, transportation, housing, and healthcare.
- All of the forty million people who rely on the Supplemental Nutrition Assistance Program (SNAP) will see their benefits cut under the Big Ugly Bill. Four million people are expected to see their food assistance benefits terminated or cut substantially.
- Similar to the changes for Medicaid, the Big Ugly Bill put in place new requirements to provide evidence of work for certain SNAP recipients. The new requirements will make SNAP harder to access for older adults, caregivers, veterans, people experiencing homelessness, and youth leaving the foster care system. Again, these red tape-laden work requirements in the bill are unlikely to actually increase employment, but they can result in a loss of benefits even for those who do work.
- Over time, SNAP benefits will shrink for all forty million people who use the program, because of changes to how benefits are calculated. These changes are designed to help pay for tax cuts for the rich and war spending at the expense of people struggling to put food on the table.
More Money for Endless War and Mass Deportations
- The Big Ugly Bill gave $156 billion more to the Pentagon for war and weapons. The law brought total war spending to over $1 trillion during peacetime, for the first time ever. That $1 trillion war budget enabled the invasion of Venezuela and the kidnapping of that country’s president, and then the unjustified and immoral war on Iran, all in the space of just two months.
- The president started a major war on Iran, with deaths mounting and costs in early April 2026 reaching near $31 billion. The war is completely unjustified, illegal, and unpopular.
- As of early April 2026, the U.S. war on Iran had caused the deaths of 4,000 people and displaced 4 million people in the wider region seeking safety from the war, according to the World Health Organization. Costs for the war on Iran were reaching $31 billion, and still mounting.
- Half of Pentagon spending goes to corporate contractors. The top five Pentagon contractors paid their CEOs an average of $24,632,610.
- The Big Ugly Bill added $170 billion for the Trump-GOP mass deportation machine. Spending for the mass deportation and detention agencies, Immigration and Customs Enforcement (ICE) and Customs and Border Protection (CBP) would more than double since FY 2024 if the GOP enacts their planned spending increases this year.
- Mass deportations and detentions are terrorizing communities. As of early April 2026, fifteen people had already died in ICE custody since the beginning of the year. That doesn’t include the deaths of Renee Good or Alex Pretti at the hands of immigration agents.
- The Big Ugly Bill provided $45 billion to expand immigrant detention centers. The Trump administration resumed the practice of detaining immigrant children, detaining 6,200 children during his second term so far.
- The president has abused the National Guard to take over the cities of Washington, DC; Portland, Oregon; Los Angeles, California; Memphis, Tennessee; and Chicago, Illinois; at a cost of $496 million in 2025 alone – and with troops still deployed in Washington, DC and Memphis, the costs continue to mount.
The Rich and Big Corporations are the Winners
- The richest 1 percent will receive more than $1 trillion in tax cuts over the next decade thanks to the Big Ugly Bill.
- For working families, cuts to health care, student loans, and other vital services under the law wipe out the minor tax benefits. A Penn Wharton analysis found that the poorest one-fifth of households would be expected to lose $885 in 2030 under the bill’s provisions, while eighty percent of the bill’s benefits would flow to the top ten percent.
- Many of the Big Ugly Bill’s tax cuts for the wealthy and corporations are permanent, while tax cuts targeted to working people, like no tax on tips or overtime, are temporary, ending after 2028.
- Despite modest increases in the maximum Child Tax Credit, the Big Ugly Bill will still deny benefits to an estimated 17 million children whose parents earn too little to receive the full credit, denying help to the poorest children. An estimated two million more children will lose access because of their parent’s immigration status, even though they were previously eligible.
- The Big Ugly Bill kept the corporate tax rate at 21%, a drastic reduction from the 35% pre-2018 rate – despite the fact that ordinary workers have not benefited from this rate reduction.
What’s Next on Their Agenda: More of the Same
The Trump-GOP’s budget priorities for 2026 and beyond promise more of the same, enriching the wealthy and inflicting violence while cutting programs for poor and struggling people:
- Increasing the war budget by 42 percent, from $1.05 trillion to $1.5 trillion in a single year. The last time military spending topped $1 trillion was World War II. It has been reported that the president will also ask for an additional $80-$100 billion for the war on Iran. Every dollar added to the war budget by any means will enable more wars, whether that means the continuation or expansion of the war on Iran, or invasions or attacks on other countries. The president has expressed interest in using military force against Greenland, Mexico, Cuba, Colombia, and other countries.
- Increasing the mass deportation budget, adding more funds on top of the $170 billion passed in last year’s Big Ugly Bill and targeting Black and Brown communities for violent treatment. More funding for mass deportation means more violence by immigration agents, more abuse of immigrants in detention, more racial profiling, and more family separation.
- Slashing $4 billion in home heating and cooling assistance for low-income households (Low-Income Home Energy Assistance Program/ LIHEAP). In FY 2024, nearly 6 million households received help with heating and energy costs, including 2.5 million households with older adults, 2.1 million households where someone had a disability, and nearly a million households with young children.
- Slashing nutrition funding for low-income women and children (Women, Infants and Children/WIC). Cuts would mean that fruit and vegetable benefits for young children would drop from $27 per month to just $10.
- Cutting at least $3.8 billion from housing, homelessness, and community development programs. The proposal would completely eliminate an eviction protection program that provided legal services to people at risk of eviction, and the Fair Housing Initiatives Program, which provided testing, evaluations and outreach to prevent housing discrimination.
Over all, the president’s budget proposes $73 billion in cuts to non-military programs and $446 billion in new military spending. GOP leaders are reportedly discussing additional healthcare cuts to pay for military spending, including the war on Iran.
State Impacts: How Many People Could Have Medicaid or SNAP Instead of $156 Billion in War Spending?
The Big Ugly Bill added $156 billion in war spending – money that has enabled the war on Iran and other military misdeeds, like the invasion of Venezuela and the occupation of U.S. cities by the National Guard. That money brought the war budget to more than $1 trillion for the first time since World War II.
Trump and his GOP allies now want to increase the war budget by 42 percent, to $1.5 trillion – a sum that would only enable more wars, and impoverish our country further.
Instead of spending tax dollars for war, we could spend them restoring the cuts from the Big Ugly Bill – and have enough to expand health insurance and food assistance for more people.
The table shows that in the vast majority of states, returning the tax dollars from the $156 billion war spending in the Big Ugly Bill would be enough to more than cover Medicaid and SNAP for the people losing health insurance and food assistance under the Big Ugly Bill.
Overall, the $156 billion for war from the Big Bad Bill is more than enough to cover all of the people in every state expected to lose insurance and food benefits – and provide Medicaid to an additional 4.8 million people, besides.[1]
[1] Of the four million people at risk of losing food assistance, the table shows the state breakdown for the 3.5 million at risk due to new work requirements, but $156 billion is enough to restore benefits for all four million, with enough leftover to provide Medicaid to 4.8 million people.
People Who Could Receive Medicaid or SNAP for State Taxpayer Share of $156 Billion
| State | Taxpayer share of $156 billion for military from the Big Bad Bill (in $) | People who could receive Medicaid instead | Increase in uninsured by 2034 due to HR1, ACA lapse, and other policies | People who could receive SNAP instead | People at risk of losing SNAP under new work requirements | Percent of people at-risk of losing Medicaid AND SNAp who could be covered by state’s share of $156 billion |
|---|---|---|---|---|---|---|
| Alabama | 1,365,000,000 | 286,000 | 150,000 | 591,000 | 61,000 | 100% or more |
| Alaska | 245,000,000 | 26,000 | 29,000 | 66,000 | 5,000 | 98% |
| Arizona | 2,642,000,000 | 331,000 | 420,000 | 1,207,000 | 73,000 | 95% |
| Arkansas | 760,000,000 | 128,000 | 140,000 | 349,000 | 25,000 | 100% or more |
| California | 24,351,000,000 | 3,125,000 | 1,700,000 | 10,556,000 | 368,000 | 100% or more |
| Colorado | 3,158,000,000 | 479,000 | 190,000 | 1,413,000 | 55,000 | 100% or more |
| Connecticut | 2,878,000,000 | 326,000 | 150,000 | 1,258,000 | 34,000 | 100% or more |
| Delaware | 469,000,000 | 43,000 | 46,000 | 216,000 | 13,000 | 100% or more |
| District of Columbia | 599,000,000 | 49,000 | 32,000 | 257,000 | 14,000 | 100% or more |
| Florida | 10,972,000,000 | 2,218,000 | 1,500,000 | 4,973,000 | 253,000 | 100% or more |
| Georgia | 3,934,000,000 | 784,000 | 500,000 | 1,744,000 | 154,000 | 100% or more |
| Hawaii | 513,000,000 | 85,000 | 42,000 | 116,000 | 13,000 | 100% or more |
| Idaho | 553,000,000 | 76,000 | 50,000 | 257,000 | 8,000 | 100% or more |
| Illinois | 6,629,000,000 | 1,009,000 | 520,000 | 2,863,000 | 205,000 | 100% or more |
| Indiana | 2,170,000,000 | 214,000 | 290,000 | 920,000 | 54,000 | 92% |
| Iowa | 1,047,000,000 | 137,000 | 110,000 | 512,000 | 23,000 | 100% or more |
| Kansas | 1,086,000,000 | 114,000 | 63,000 | 496,000 | 15,000 | 100% or more |
| Kentucky | 1,199,000,000 | 129,000 | 220,000 | 619,000 | 50,000 | 58% |
| Louisiana | 1,351,000,000 | 181,000 | 330,000 | 600,000 | 68,000 | 65% |
| Maine | 458,000,000 | 50,000 | 33,000 | 216,000 | 10,000 | 100% or more |
| Maryland | 3,406,000,000 | 361,000 | 210,000 | 1,572,000 | 57,000 | 100% or more |
| Massachusetts | 5,416,000,000 | 504,000 | 210,000 | 2,298,000 | 103,000 | 100% or more |
| Michigan | 3,739,000,000 | 634,000 | 390,000 | 1,796,000 | 123,000 | 100% or more |
| Minnesota | 2,778,000,000 | 230,000 | 180,000 | 1,468,000 | 32,000 | 100% or more |
| Mississippi | 604,000,000 | 66,000 | 110,000 | 275,000 | 33,000 | 100% or more |
| Missouri | 2,083,000,000 | 222,000 | 230,000 | 901,000 | 58,000 | 100% or more |
| Montana | 391,000,000 | 59,000 | 50,000 | 188,000 | 7,000 | 100% or more |
| Nebraska | 715,000,000 | 73,000 | 54,000 | 333,000 | 9,000 | 100% or more |
| Nevada | 1,286,000,000 | 255,000 | 110,000 | 644,000 | 46,000 | 100% or more |
| New Hampshire | 765,000,000 | 91,000 | 32,000 | 380,000 | 4,000 | 100% or more |
| New Jersey | 6,357,000,000 | 680,000 | 390,000 | 2,723,000 | 75,000 | 100% or more |
| New Mexico | 566,000,000 | 71,000 | 98,000 | 248,000 | 55,000 | 68% |
| New York | 13,307,000,000 | 1,352,000 | 860,000 | 5,281,000 | 317,000 | 100% or more |
| North Carolina | 3,760,000,000 | 509,000 | 450,000 | 1,809,000 | 142,000 | 100% or more |
| North Dakota | 324,000,000 | 29,000 | 26,000 | 141,000 | 3,000 | 100% or more |
| Ohio | 4,265,000,000 | 540,000 | 460,000 | 1,857,000 | 98,000 | 100% or more |
| Oklahoma | 1,111,000,000 | 203,000 | 180,000 | 505,000 | 58,000 | 100% or more |
| Oregon | 1,706,000,000 | 225,000 | 210,000 | 808,000 | 62,000 | 99% |
| Pennsylvania | 5,864,000,000 | 523,000 | 450,000 | 2,741,000 | 143,000 | 100% or more |
| Rhode Island | 503,000,000 | 57,000 | 42,000 | 211,000 | 10,000 | 100% or more |
| South Carolina | 1,616,000,000 | 308,000 | 190,000 | 724,000 | 49,000 | 100% or more |
| South Dakota | 308,000,000 | 41,000 | 20,000 | 128,000 | 5,000 | 100% or more |
| Tennessee | 2,423,000,000 | 379,000 | 210,000 | 1,059,000 | 52,000 | 100% or more |
| Texas | 12,620,000,000 | 1,735,000 | 1,400,000 | 5,574,000 | 275,000 | 100% or more |
| Utah | 1,140,000,000 | 149,000 | 150,000 | 503,000 | 12,000 | 100% or more |
| Vermont | 278,000,000 | 32,000 | 18,000 | 124,000 | 6,000 | 100% or more |
| Virginia | 4,439,000,000 | 434,000 | 350,000 | 2,076,000 | 78,000 | 100% or more |
| Washington | 4,818,000,000 | 663,000 | 430,000 | 2,223,000 | 57,000 | 100% or more |
| West Virginia | 416,000,000 | 53,000 | 75,000 | 204,000 | 34,000 | 78% |
| Wisconsin | 2,337,000,000 | 320,000 | 110,000 | 1,206,000 | 49,000 | 100% or more |
| Wyoming | 264,000,000 | 38,000 | 9,700 | 135,000 | 2,000 | 100% or more |
| Total | 155,984,000,000 | 20,626,000 | 14,219,700 | 69,364,000 | 3,555,000 | 100% or more |
Totals may not add due to rounding. Sources: Author’s calculations based on IRS tax data, Kaiser Family Foundation Medicaid cost and at-risk estimates, USDA cost estimates for SNAP, and CBPP at-risk estimates for SNAP.
Subscribe to our newsletter
Further reading

Tax Day 2026: The Average Taxpayer Paid $4,049 for War and Weapons
Trump's Budget Policies Make the Poor Poorer to Pay for War and Help the Rich