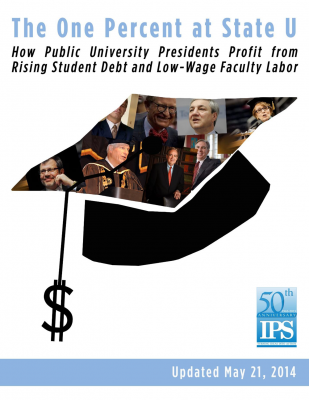
 State universities have come under increasing criticism for excessive executive pay, soaring student debt, and low-wage faculty labor. In the public debate, these issues are often treated separately. Our study examines what happened to student debt and faculty labor at the 25 public universities with the highest executive pay (hereafter “the top 25”) from fall 2005 to summer 2012 (FY 2006 – FY 2012). Our findings suggest these issues are closely related and should be addressed together in the future.
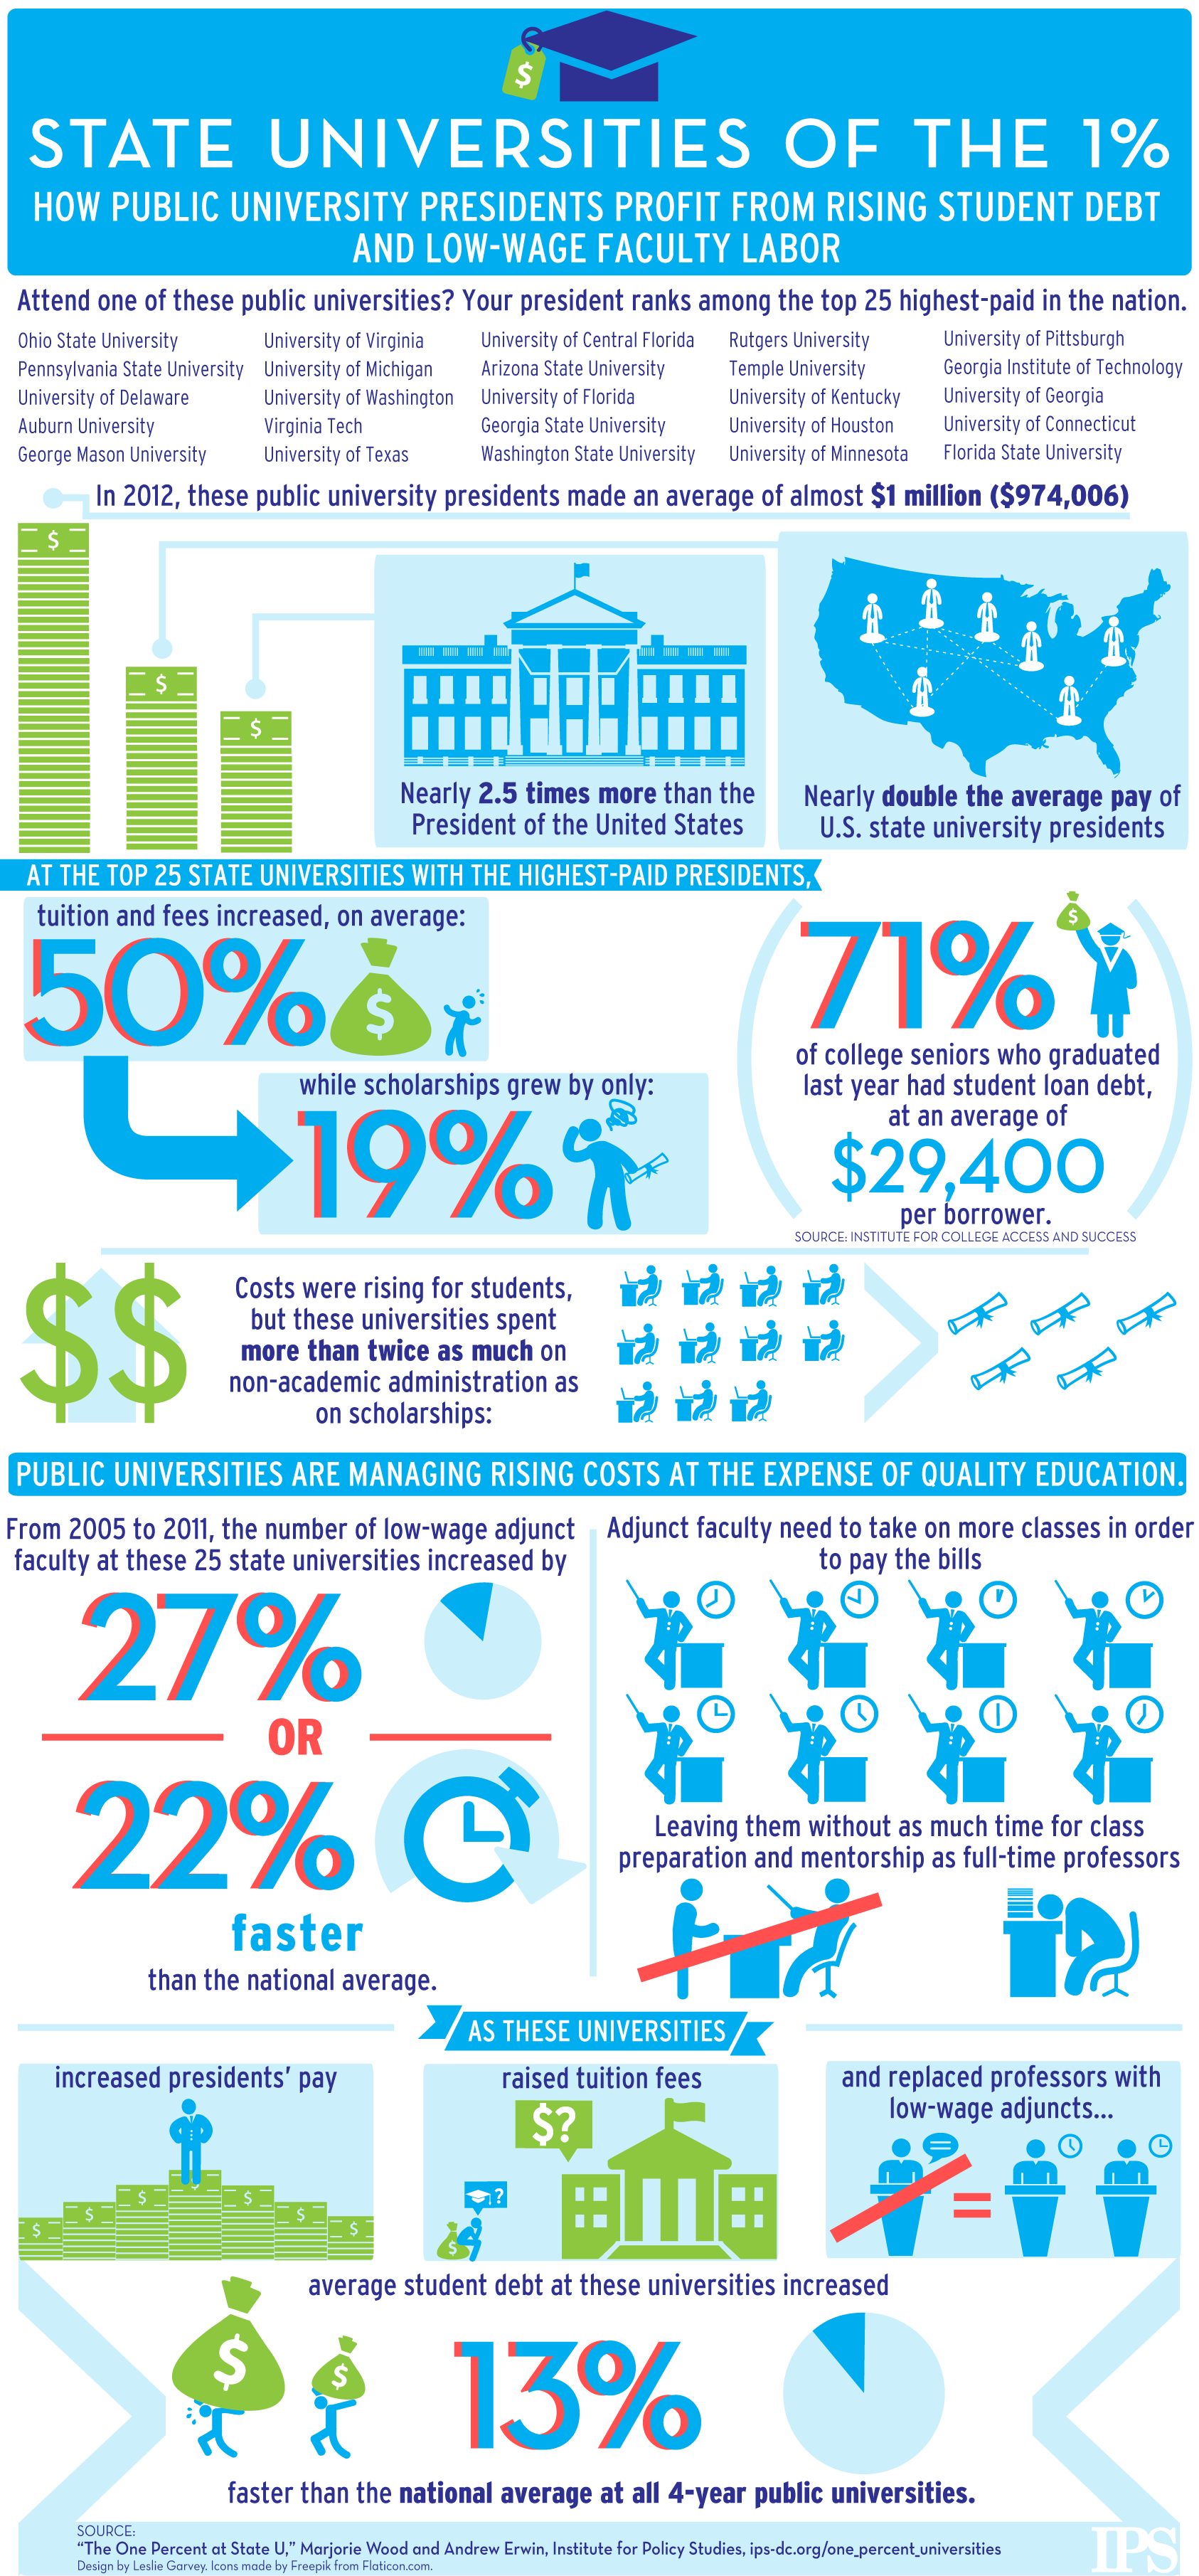
Since the 2008 financial crisis, executive pay at “the top 25” (see Appendix 2) has risen dramatically to far exceed pre-crisis levels. From fall 2005 to fall 2011, low-wage faculty labor and student debt at these institutions rose faster than national averages. In short, a top-heavy, “1% recovery” occurred at major state universities across the country, largely at the expense of faculty and students.
Key Findings:
- The student debt crisis is worse at state schools with the highest-paid presidents. The sharpest rise in student debt at the top 25 occurred when executive compensation soared the highest.
- As students went deeper in debt, administrative spending outstripped scholarship spending by more than 2 to 1 at state schools with the highest-paid presidents.
- At state schools with the highest-paid presidents, part-time adjunct faculty increased 22 percent faster than the national average at all universities.
- At state schools with the highest-paid presidents, permanent faculty declined dramatically as a percentage of all faculty. By fall 2009, part-time and contingent faculty at the top 25 outnumbered permanent faculty for the first time.
- Average executive pay at the top 25 rose to nearly $1 million by 2012 — increasing more than twice as fast as the national average at public research universities.
A simple guide [PDF] to the numbers behind “The One Percent at State U”
Infographic of Key Findings: