Tax Day 2019: Where Your Personal Income Taxes Were Spent in 2018
Tax Day 2019
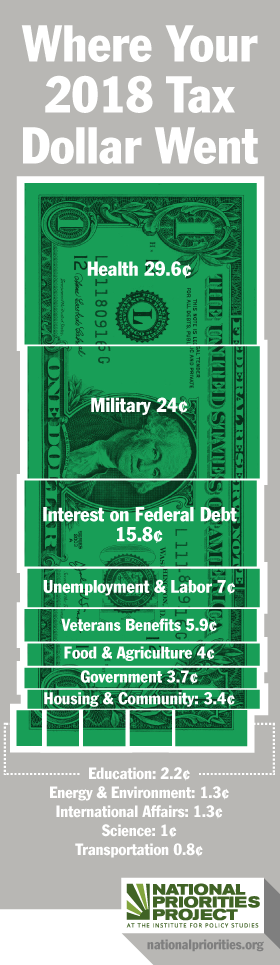
Where Your 2018 Tax Dollar Was Spent
Lindsay Koshgarian | Ashik Siddique
Introduction:
Tax Day is April 15, 2019, the last day to file our tax returns for all income received in 2018. Want to know what your taxes pay for? Check out our resources below. They include a breakdown of where the federal government spends your tax dollars, a tool that let’s you calculate your own tax receipt or see an average for your state, a tool that let’s you make up your own federal spending choices, some surprising tax day facts, and more.
Key Findings:
- Pentagon & Military — the average U.S. taxpayer pays more to private military contractors than funds that directly support the troops
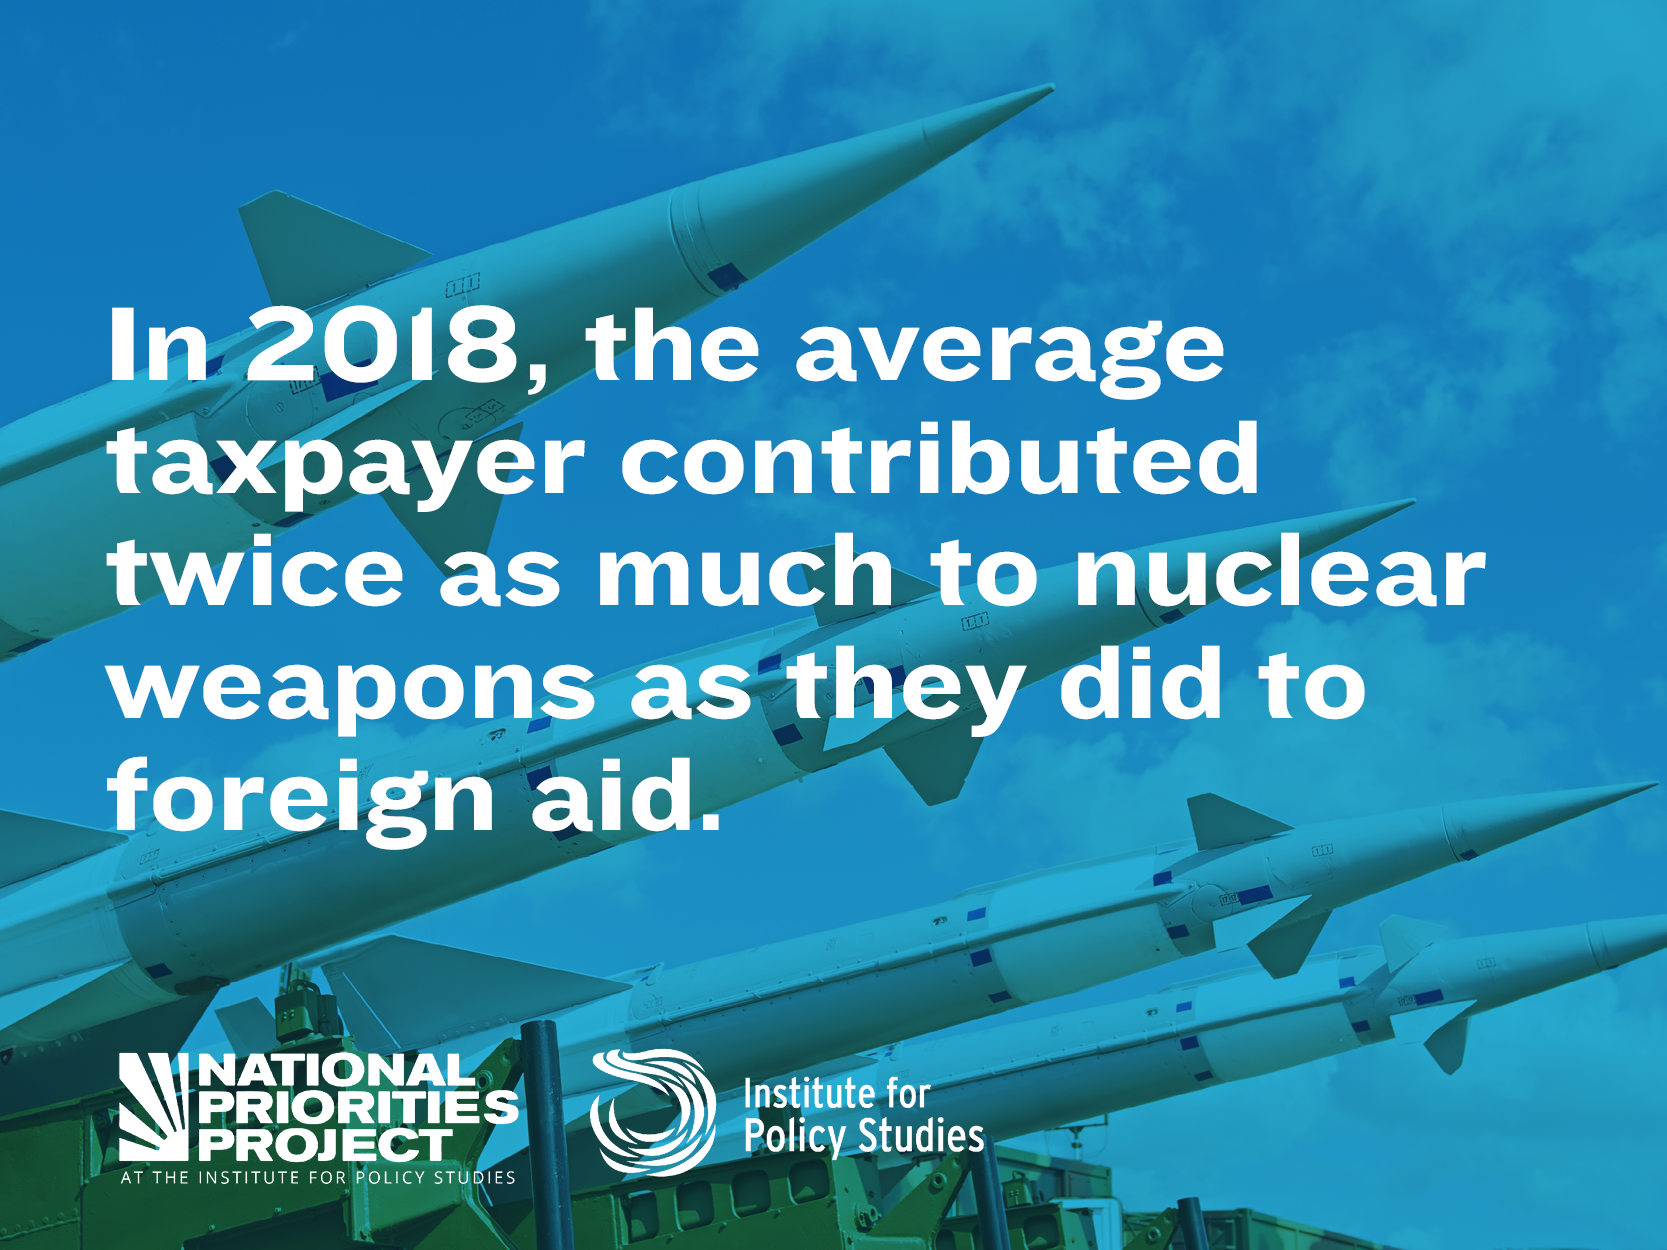
- Nuclear weapons — the U.S. spends more on proliferating weapons of mass destruction than we do on foreign aid and diplomacy, the EPA, or CHIP
- Education — the U.S. government spend as much taxpayer money separating families as it does on K-12 education
- Health care — this is the taxpayer’s biggest tab, with Medicare and Medicaid providing health care for 1 in 3 people in the U.S.
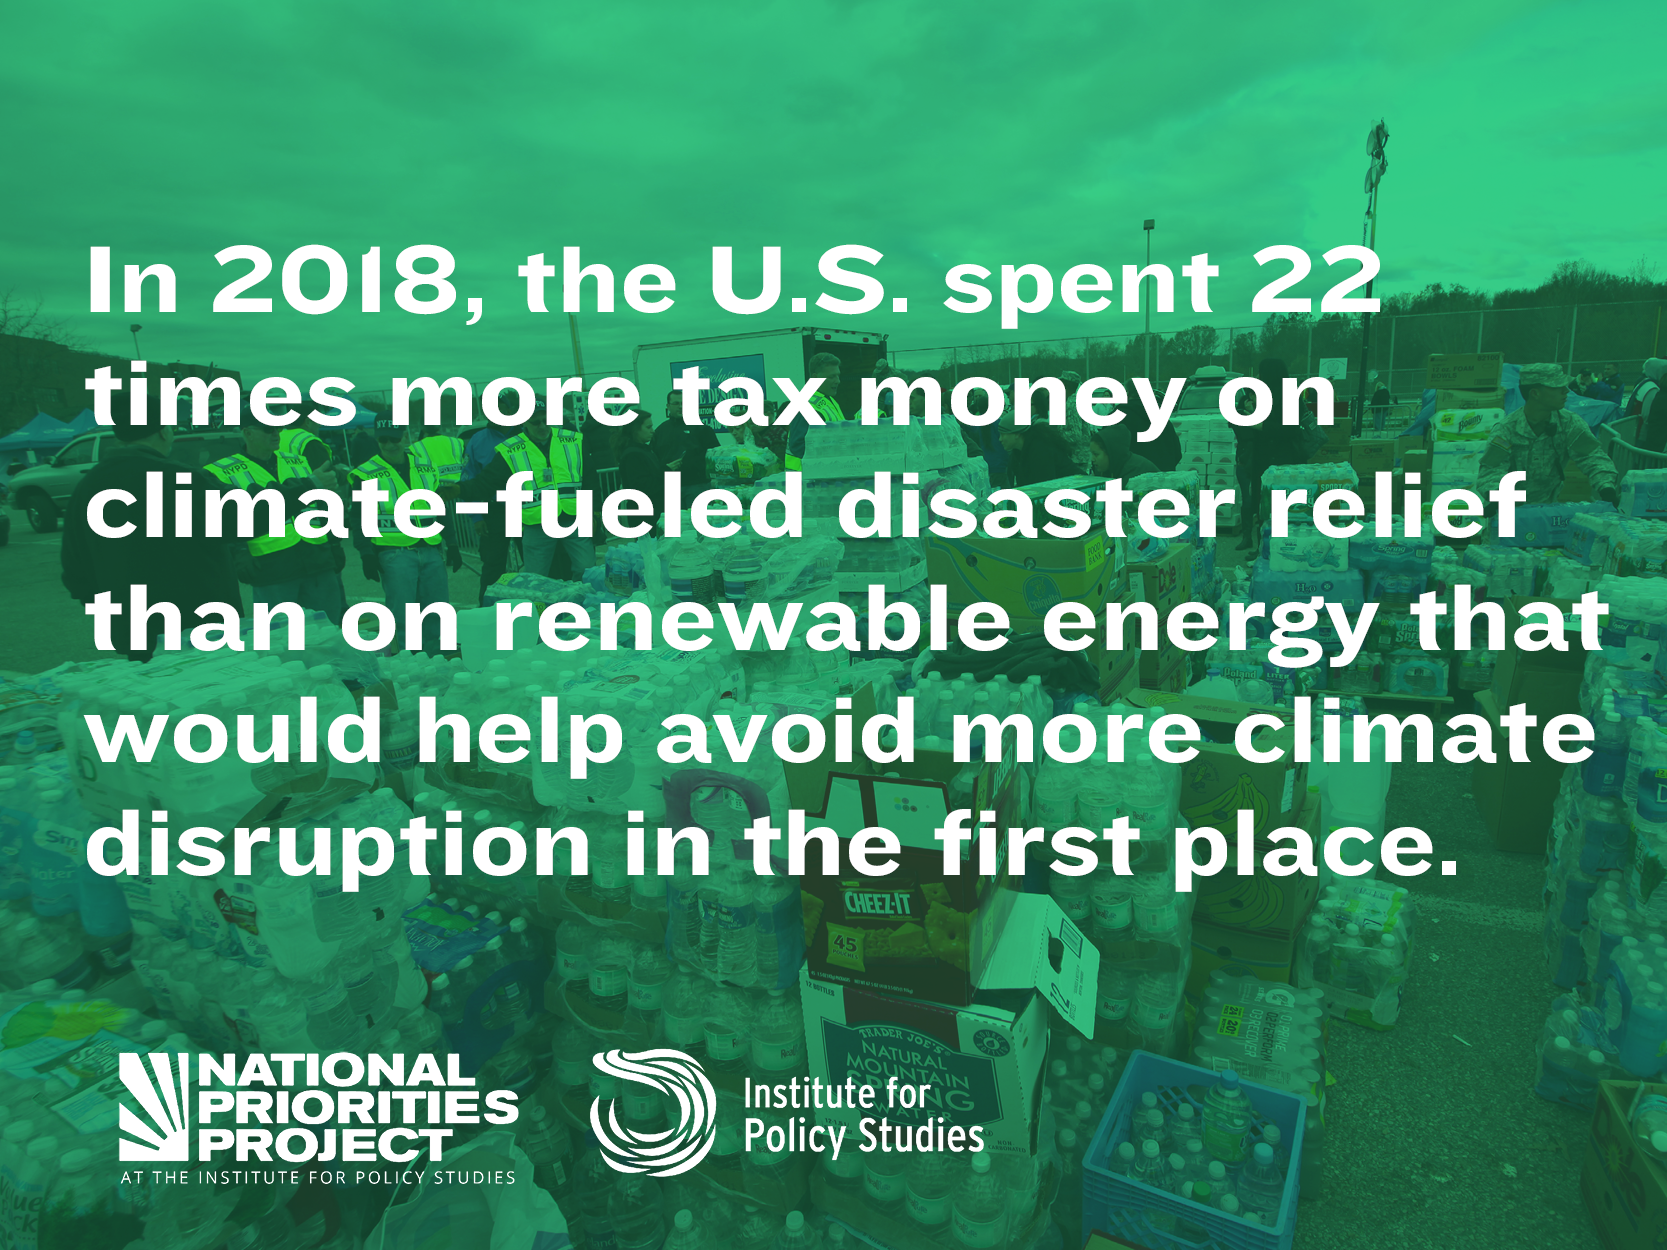
- Climate, Energy, & Environment — many more of your tax dollars go to disaster relief than to investments like renewable energy that could help prevent the worst disasters
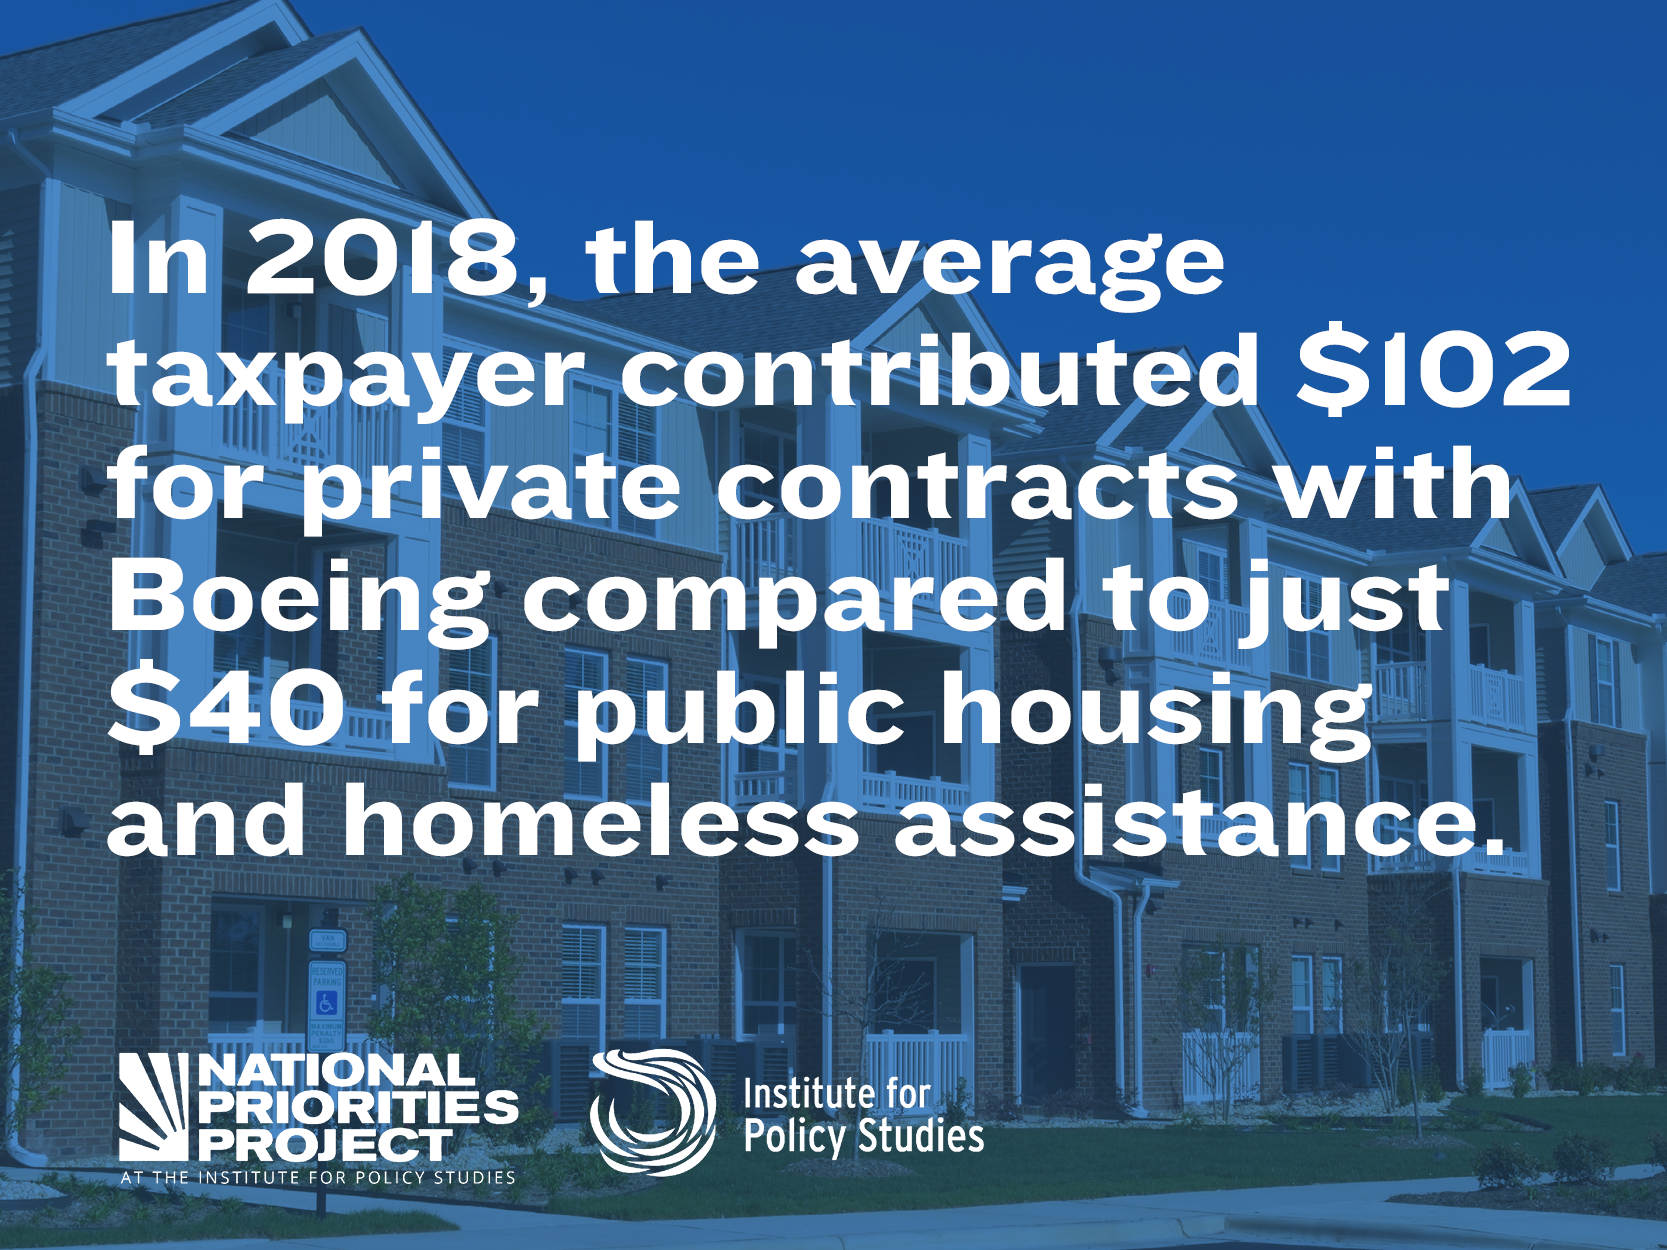
- Poverty and Low-Income — in the age of growing income inequality, the average taxpayer contributes more to private DoD contractors than to labor and unemployment programs
- Thirty-seven percent of Black families and 33% of Latino families have zero or negative wealth, compared to 15.5% of White families.
- The Forbes 400 richest Americans own more wealth than the entire Black population plus a quarter of the Latino population combined.
- Jeff Bezos, founder of Amazon, owns $160 billion in total wealth. That is 44 million times more wealth than the median Black family, and 24 million times more wealth than a Latino family.
- Systemic discrimination has made Black families 20 times more likely to have zero or negative wealth than to have $1 million, while white families have equal likelihood of either.
Calculate Your Own Tax Receipt
Your Federal Income Tax Receipt
Some people think the federal government should give them a receipt for their income taxes to show where all that money went. While you may not get a receipt from the IRS any time soon, National Priorities Project went ahead and wrote one up.
Wealth at the Middle
- Today, the median family in the United States owns $81,704, compared to $84,110 (adjusted for inflation) in 1983. That means despite three decades of economic growth and leaps in productivity, the typical U.S. family saw zero benefit, and their wealth go down.
- This reduction was not experienced evenly across racial groups. Median White family wealth today is $146,984, up from $110,160 in 1983, a 30 percent increase. So, the median White family wealth went up by tens of thousands of dollars while Black and Latino wealth bounced around mostly at asset poverty levels.
Wealth at the Top
- Three dynastic wealth families—the Waltons, the Kochs, and the Mars—have seen their wealth increase nearly 6,000 percent since 1982.
- Policies are skewed to help households with wealth continue to gain and maintain their wealth. Over the past 33 years, the top 0.1 percent grabbed 16 percent of the total gain in household and the top 20 percent of wealth owners captured 97.4, leaving just 2.6 percent to be shared by the bottom 80 percent of the country, just over 100 million families.
- The percentage of White families that are worth a million dollars has increased from 7 percent in 1992 to 15 percent in 2016. Only about 2.3 percent of Latino households and 1.9 percent of Black households had a net worth over a million dollars in 2016.
Wealth at the Bottom
- One in five U.S. families has zero or negative net wealth today, meaning they owe more money than they own.
- Black and Latino families are twice as likely to have zero or negative wealth as White families.
- 37 percent of Black families and 32.8 percent of Latino families have zero or negative wealth.
- Four in ten families could not come up with $400 cash if they needed it in an emergency.

Seven Surprising Tax Facts for 2019
Did you know that with your tax money, the government spends more on nuclear weapons than on the Environmental Protection Agency, or the Children’s Health Insurance Program? Or that health care is the biggest item on your tax receipt? Have you thought about how spending on disaster relief compares to spending on agencies designed to curb the climate change that accelerates those disasters? Download our fact sheet for some surprising 2019 Tax Day facts.
- Thanks to the Trump tax deal, taxes are way down for corporations and billionaires.
- Federal taxes end up in your hometown.
Make Your Own Federal Spending Choices
For the military in 2018, taxpayers in the United States are paying $XXX billion. Would you have preferred your tax dollars go to college financial aid programs or infrastructure jobs instead? We’ve calculated possible trade-offs so you can build your ideal federal spending plan:

Notes and Sources
Tax Day shows how your individual income taxes were spent. Those are a portion of the taxes withheld from your paycheck, and due this year on April 15, 2019. Tax Day materials do not include corporate taxes or the individual payroll taxes that directly fund Social Security and Medicare. To read more about where federal revenues come from, visit Where the Money Comes From.
Our Tax Day materials show how federal funds were spent during fiscal year 2018, the time period that most closely corresponds to the calendar year for which income taxes are due. In order to do this analysis, we separate federal funds from trust funds. Trust funds, generated from sources such as payroll taxes, can only be used for specific programs like Social Security and Medicare. All other funds are federal funds, including revenue from your federal income taxes, and can be used for a wide variety of purposes.
We use analyzed federal fund “outlays” for FY 2018 from the FY 2020 Budget as reported by the White House Office of Management and Budget’s (OMB) and available from the Government Printing Office. These are the most recent available data for legally enacted federal spending at the time of publishing.
Help Spread the Word: #TaxDay2019 #ShowTheReceipts
Help us spread the word about our Tax Day findings by sharing the images below with the hash tags #ShowTheReceipts and #TaxDay2019


Twitter and Facebook
Systemic discrimination has made Black families 20x more likely to have zero or negative wealth than to have $1M, while white families have equal likelihood of either. The U.S.’s #RacialWealthDivide is staggering: www.ips-dc.org/dreamsdeferred/ Share on Twitter Share on Facebook
Today’s #Forbes400 list own more wealth than all Black households in the U.S. PLUS a quarter of Latino households. This #RacialWealthDivide is deeply systemic—but there are solutions: www.ips-dc.org/dreamsdeferred Share on Twitter Share on Facebook
Today the median white family has 41x more wealth than the median Black family and 22x more wealth than the median Latino family. This #RacialWealthDivide is a direct result of policy discrimination: www.ips-dc.org/dreamsdeferred Share on Twitter Share on Facebook
The median Black family in the U.S. owns just 2% of the wealth of the median white family, and the median Latino family only 4%. Learn more about the systemic reality of the #RacialWealthDivide: www.ips-dc.org/dreamsdeferred Share on Twitter Share on Facebook
#AgriculturalCooperatives in the South have historically offered not only sustainable jobs and fresh food to underserved communities, but also job training, affordable housing, and daycare to members who needed it. This is the vision that should pave the way for the South. Share on Facebook
Our #AgriculturalCooperatives report gives several examples of successful black-owned farming co-ops in areas of high poverty, including a case study of the successful Mississippi Delta Southern Rural Black Women in Agriculture—the first agricultural co-op run entirely by women in the South.
The Farm Service Cooperative, the single largest African American co-op in the country, supports dozens of co-ops throughout the region in sectors like credit unions, farming, and homecare. Find out more about the history of success in black-owned #AgriculturalCooperatives:

Download our Key Facts and Findings
Media Contacts:
Robert Alvarez
robert@staging.ips-dc.org
202-787-5205
Subscribe to our newsletter
Further reading

FAQ: Why Is the U.S. Attacking Iran? And What Happens Next?

FACT SHEET: How Much Is the War in Iran Costing American Taxpayers?